Analysis and Classification of Aerial LiDAR Data
The purpose of this project was to analyse some LiDAR (Light Detection and Ranging) data from a drone and to classify the detected objects. Our lidar data is related to mountain regions where there can be different kinds of vegetation, high-voltage electric lines, rivers or houses. This kind of analysis can be useful for power line inspections by a drone or the inspection of riverbeds or the analysis of any other human or natural feature which is detectable by a lidar sensor.
A lidar dataset is essentially a set of 3D points which can be enriched with additional information like the “color” of the points or any additional spectral information. The basic difficulty of analyzing such kind of data is to be able to detect interesting structures and features on a set of data that, a priori, are completely unstructured. This is often done by exploiting additional information about the topology or the geometry of the objects that we want to detect. Moreover the fact that such datasets are often very large (around 200Mb in our case), from tens of millions to billions on points, constitute an additional technical challenge.
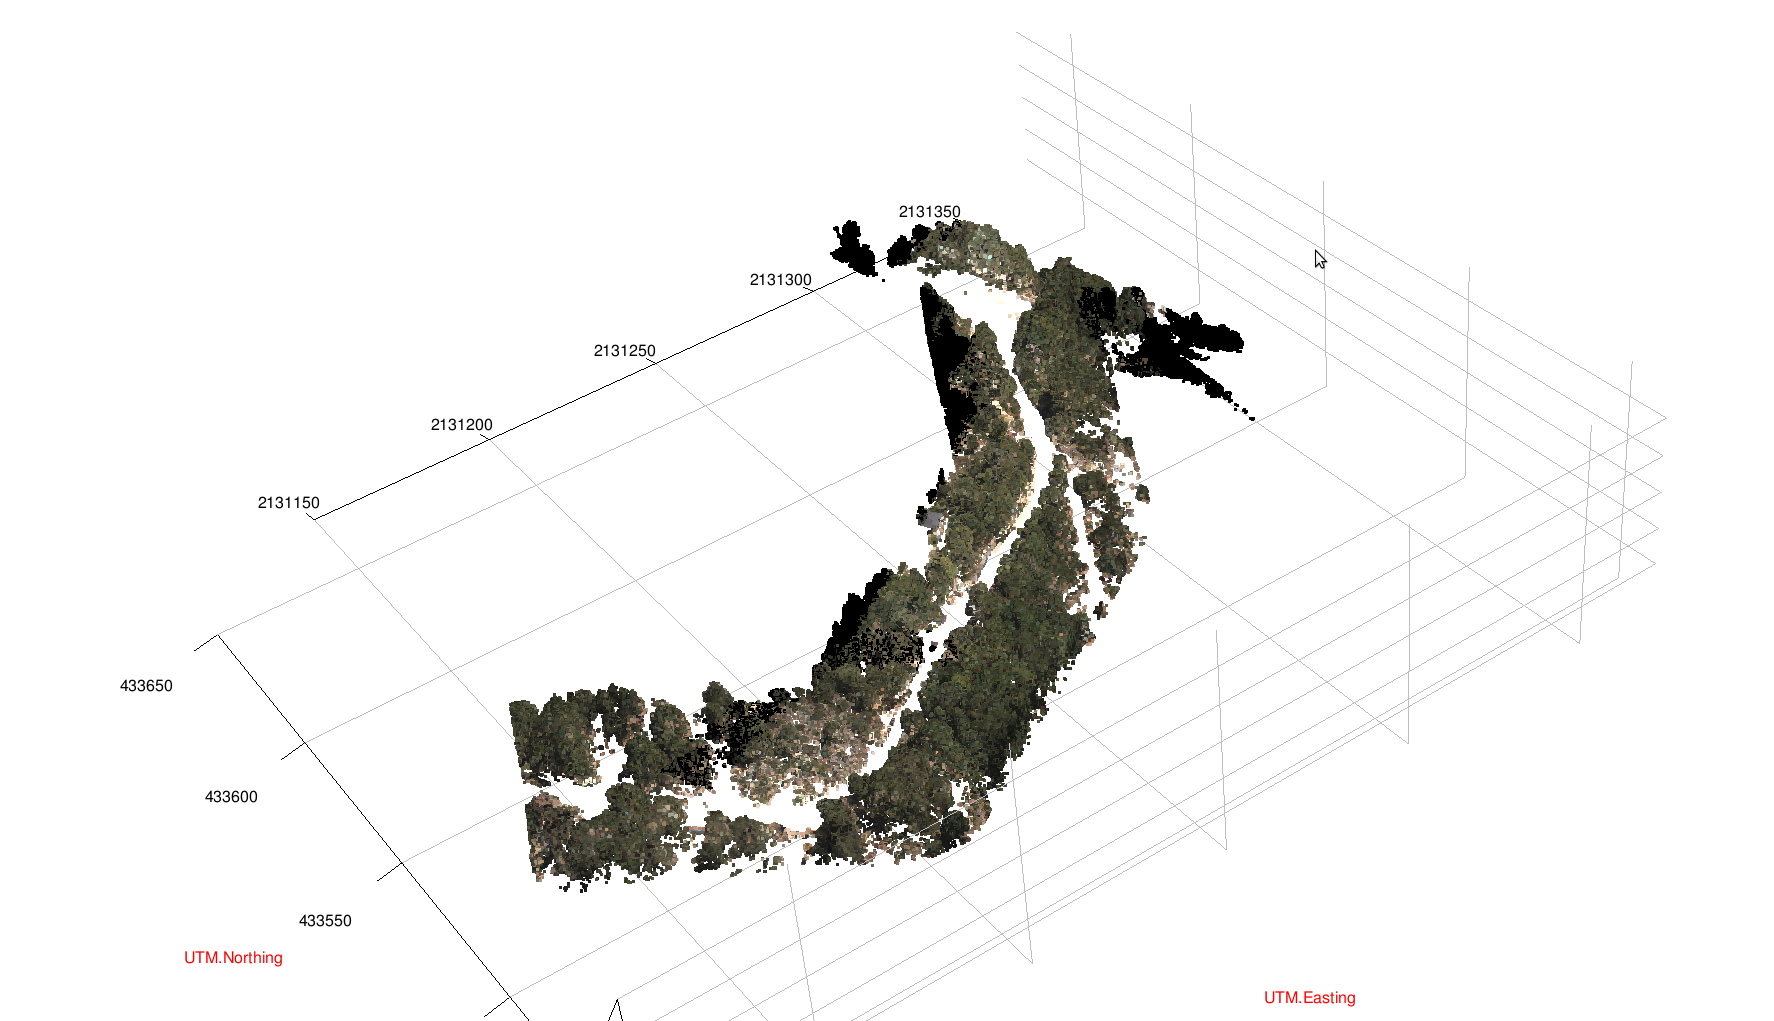
Hereafter, there is a low-resolution 3D rendering of the points cloud of our dataset. We can see that essentially it consists of a forest with different density at different places and some “empty” spaces; checking into the details of such “empty spaces” at higher resolution we can see that there are high voltage power lines and their pylons. So the key purpose of our analysis of this dataset will be to identify the exact region of each power lines, the structure of the forest and to develop a metric model that can be used to estimate the properties of such objects like their volume, their relative distances and any other geometrical properties which should be required.
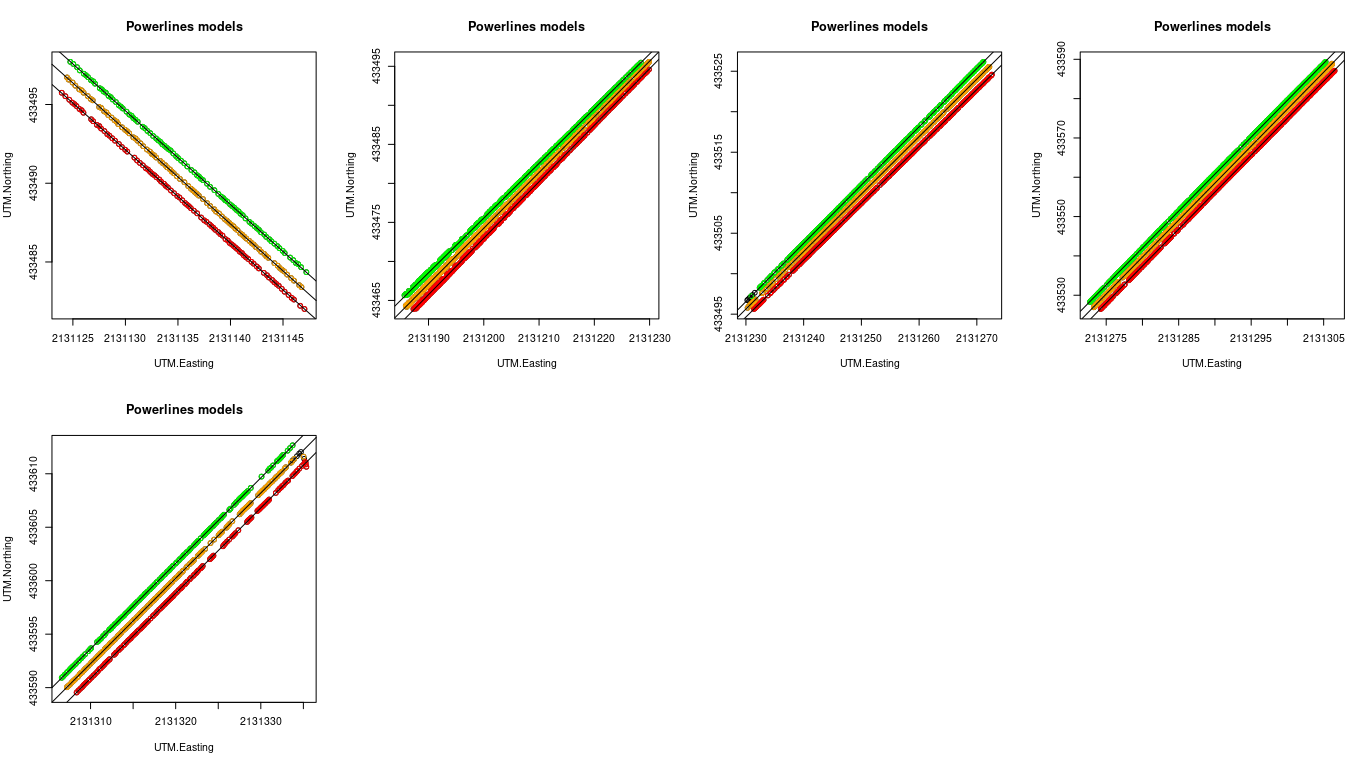
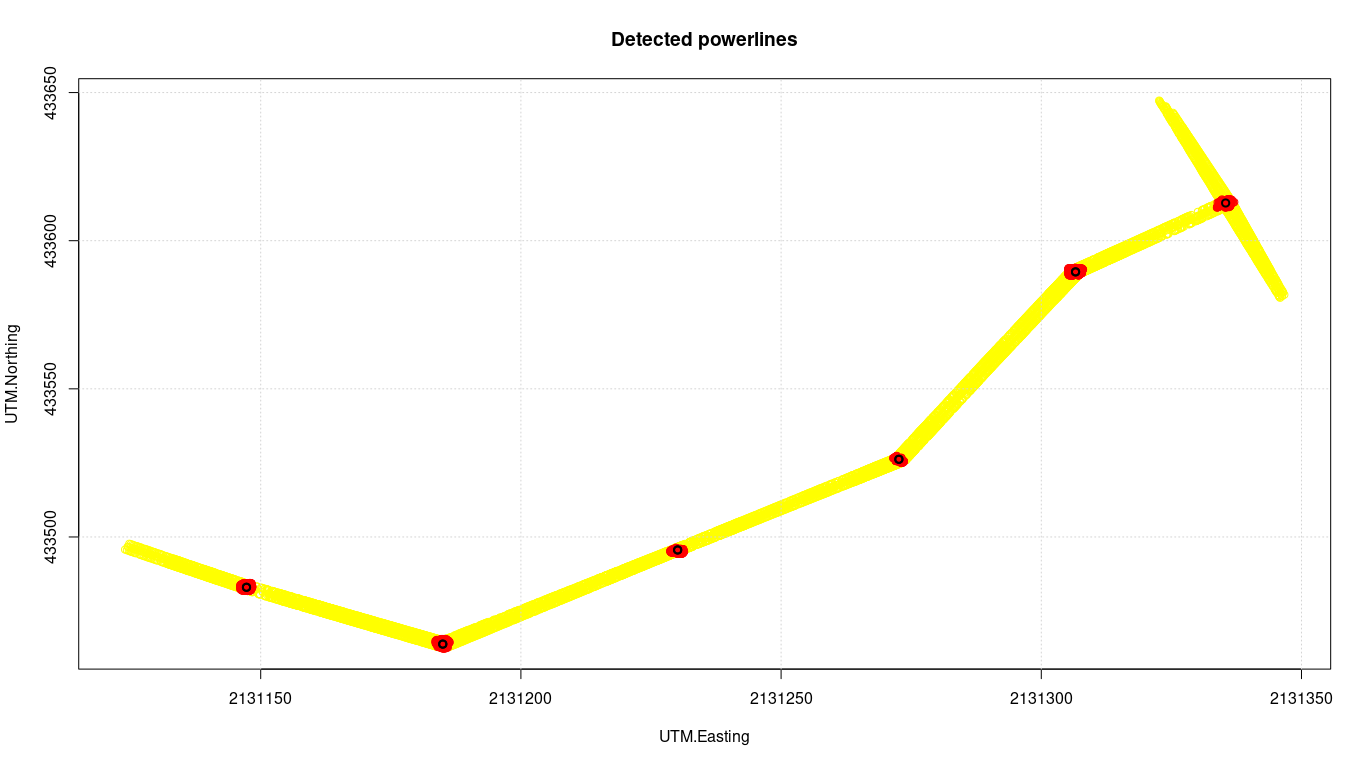
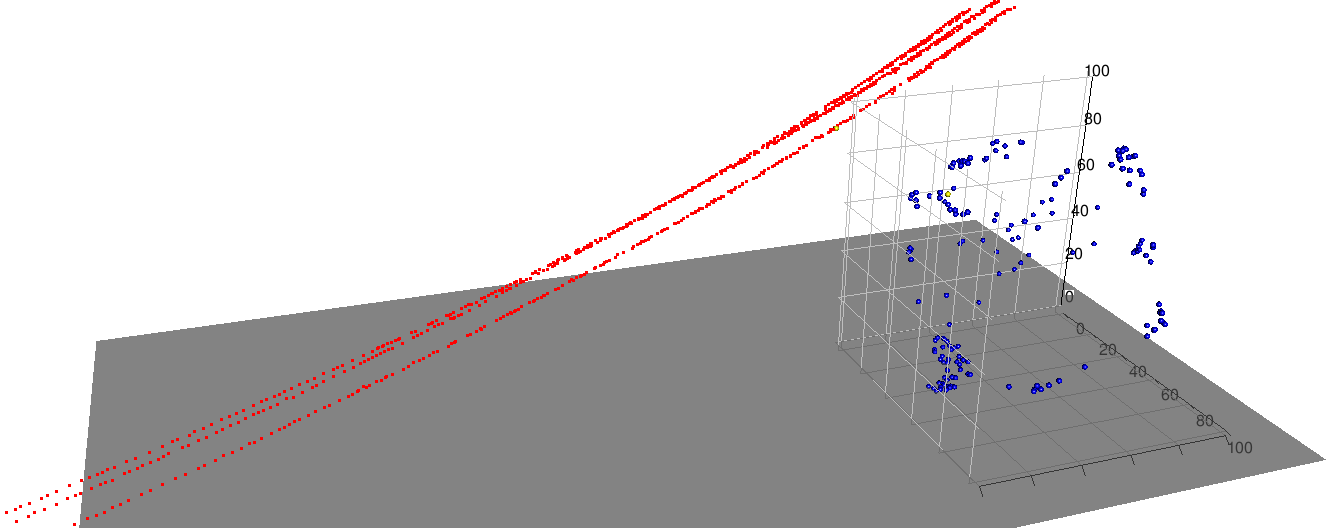
A specific algorithm has been developed to detect possible lines in a set of 3d points. We started by reviewing the research literature, several approaches are available. Yet they were not good enough in our specific case because they were not able to detect the three or two lines which make a typical power line. Generic line detection algorithms work well when there are lines with very different directions but then they can fail when two or more lines have the same direction (i.e. they are parallel) and they are near each other like it is our case. Different parallel lines are recognized by them as a single one and this is not good enough for our purpose. So, a specific algorithm was developed to detect parallel lines despite their proximity. As you can see in the following picture, 5 major sets of parallel lines have been recognized in our dataset. While the three sets of parallel lines without a pylon as endpoint have not been recognized because the detection of two endpoint pylons is integral part of the recognition algorithm. The first set of three lines would have been recognized by any standard lined detection algorithm because the set of points which constitute each line are quite far away. However, the following three cases are where standard algorithms would fail (but our approach succeed) being all the points really near each others. Finally, considering the last set and the red points we can see that even if they are visually on the same line, there are several empty spaces which are probably due to the variable speed of the drone which took the data. This is a case where standard algorithms usually detect several segment of lines instead of a single line; our approach was successful also on this configuration.
Overall, we were able te extract the full structure of the power lines present in the data. The next step was to develop an algorithm to analyze the forest and its structure in term on trees with different shapes, volume and density characteristics.
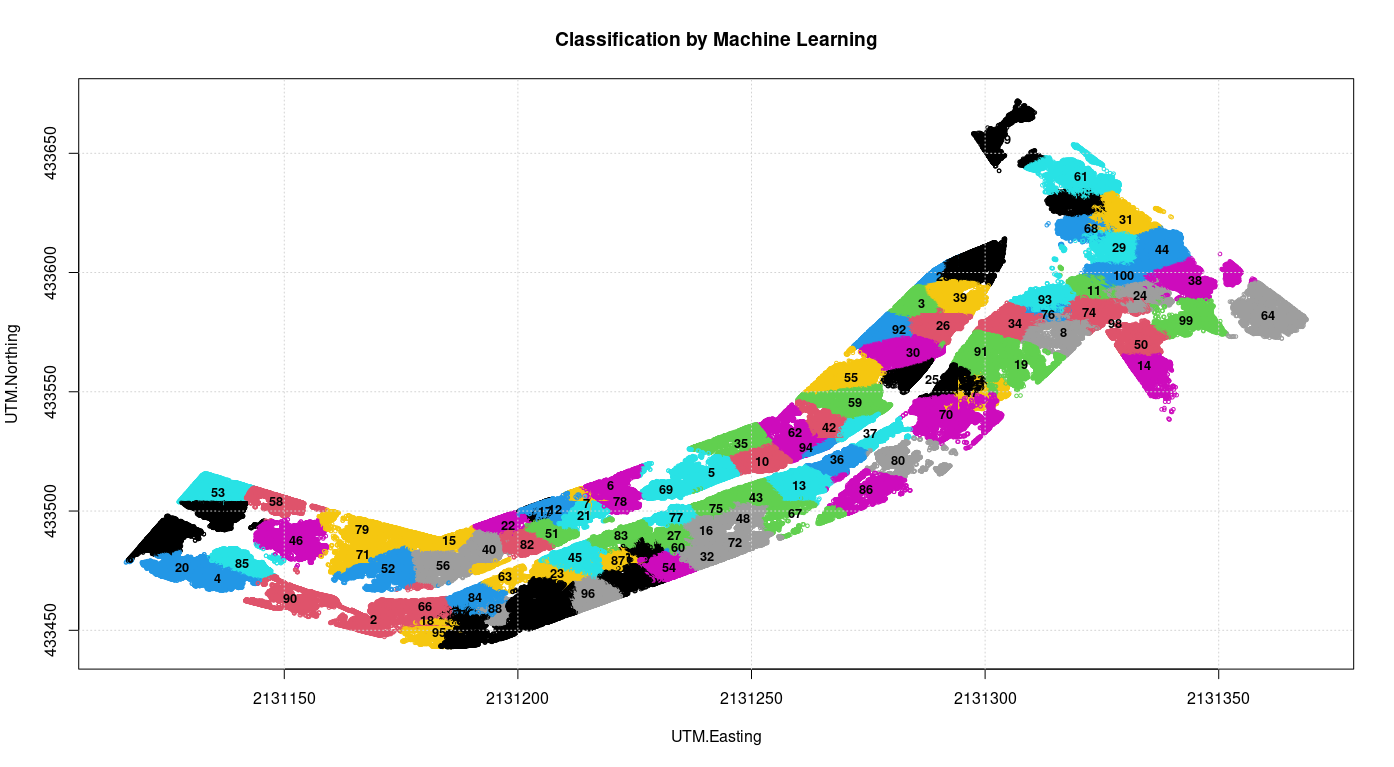
The task of splitting a surface in the minimum number of regions which are homogeneous by geometrical characteristics and properties is already a complex task. When such splitting must be done on 3D regions, the challenge is even more. Instead of adopting a geometrical approach we decided to apply a machine learning paradigm and to develop ad-hoc metrics for our problems on 3D cloud of points. The result was more successful of what we originally expected: our algorithm is able to split and to classify each region on a single analysis. Shape and size of each region depends on its homogeneity, so very dense regions are well separated by regions where the density is lower because the plants are different or they had a different growth.
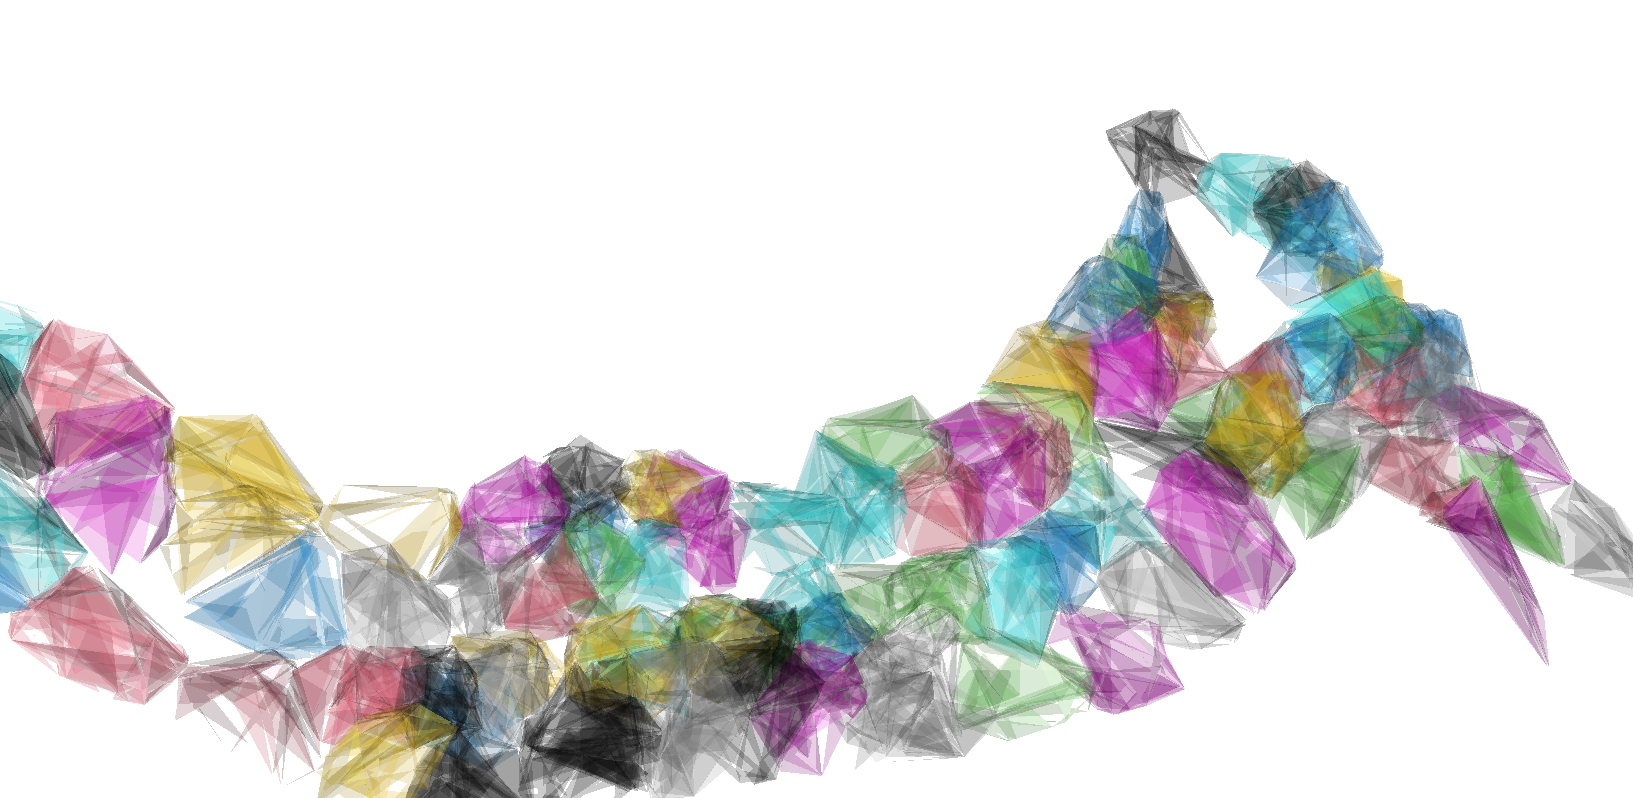
Having split the full datasets in different objects (pylons, power lines and forest regions) is essential to develop a geometrical representation of each object first, and then to apply the required statistical or geometrical analysis to such objects. From each region of forest we built a 3D simplexes representation like the ones in the following picture. From this 3d model we were able to estimate their boundaries, volume and to compute any metric distance between any two object of the representation.
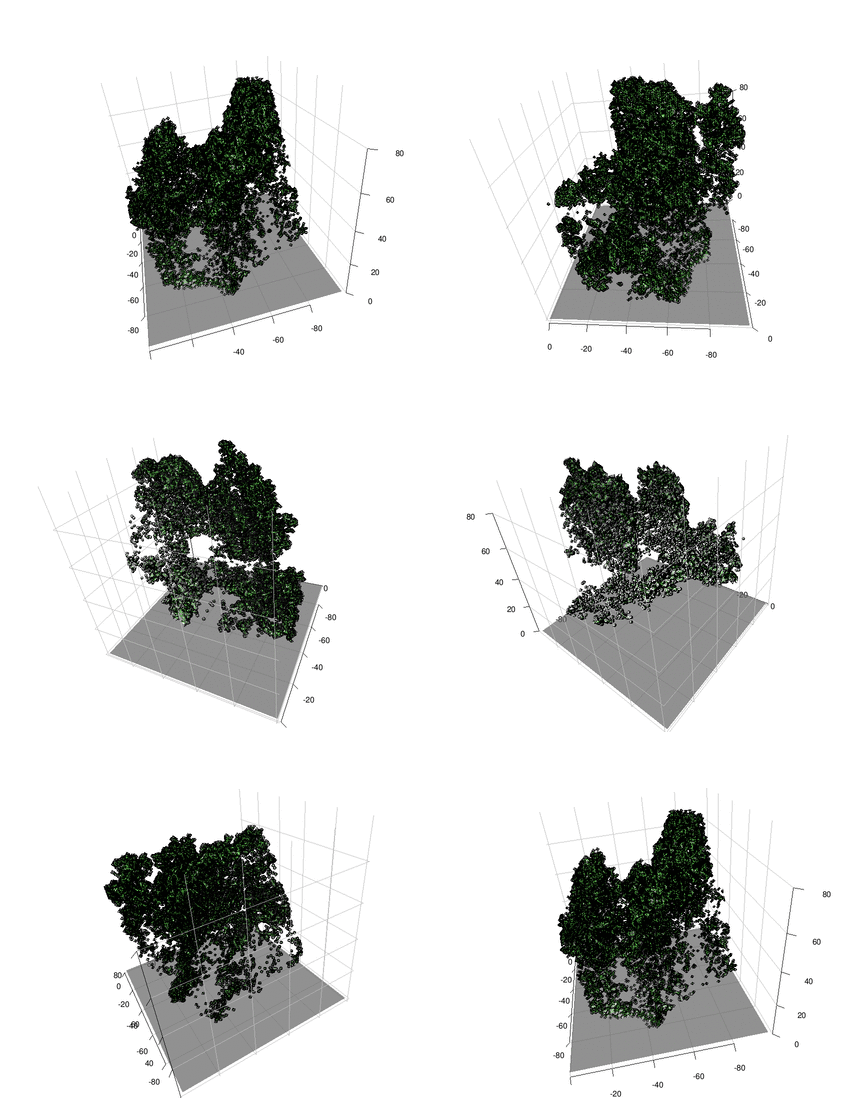
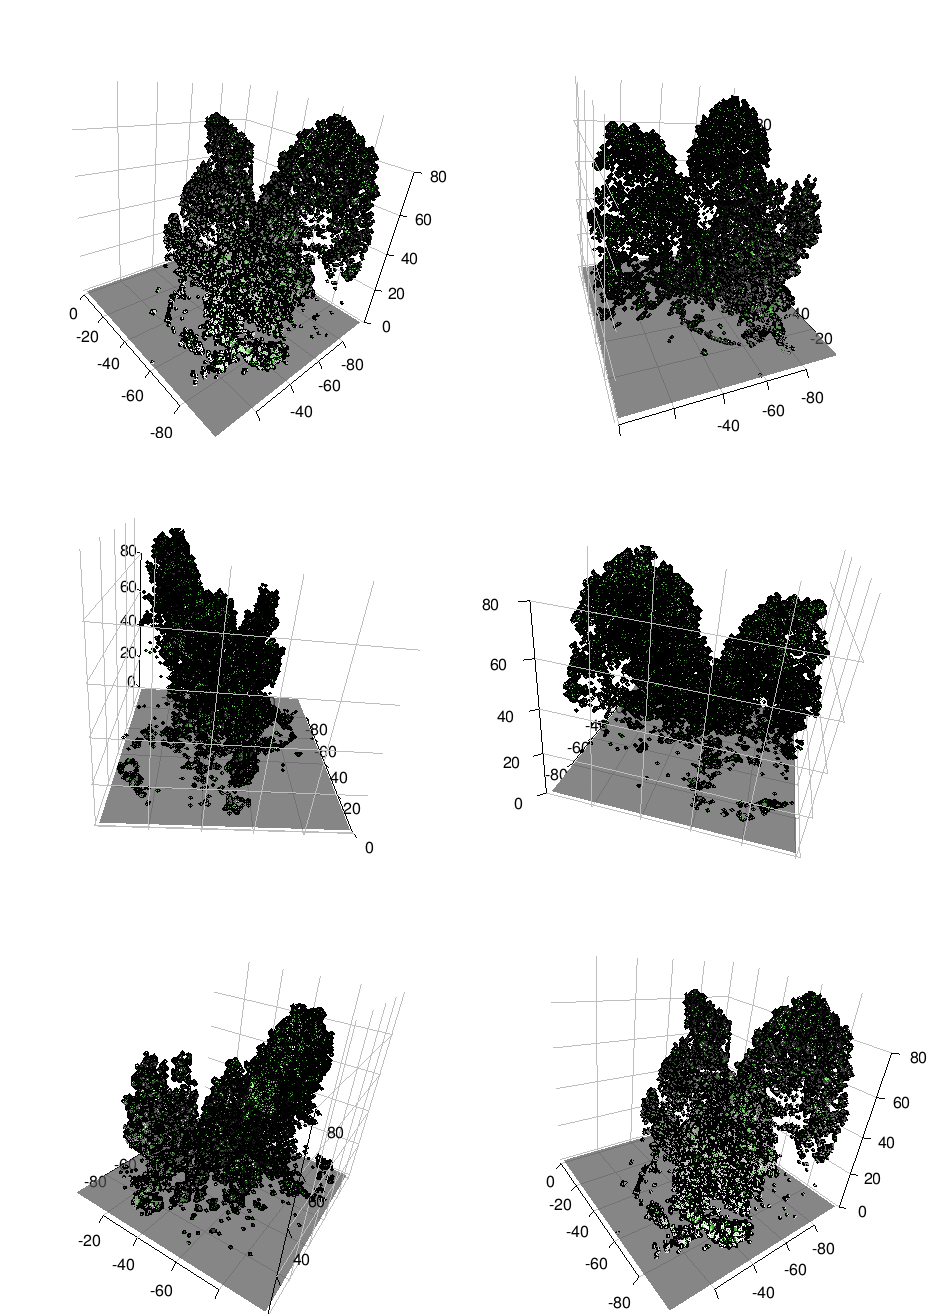
In particular, we were able to compute the relative positioning of the forest versus the power lines and therefore to detect which regions of the forest could be or become a risk for the power grid. In the following picture, for example, we have highlighted two yellow points, one on the power line and one at the boundary of the forest region, which are the two points at minimal distance.
Composing a global volumetric model of all the forest regions we are also able to have an overview of the interactions among the different regions and, when this is required, to compute distances, overlapping, volumes or statistics.
In conclusion, we started with a completely unstructured set of lidar points and we were able to recover the geometric structure of present objects, their interaction, some relevant metrics and a global 3D model.

